Financial Loan Analysis 2021
Table of Contents
- Project brief
- Questions
- Data source
- Tools
- Stages
- Chart types and why
- Processing
- Dashboards
- Data Transformation
- Findings
- Recommendations
Project brief
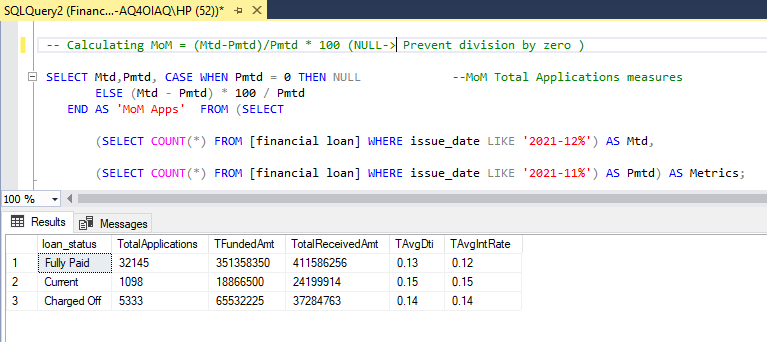
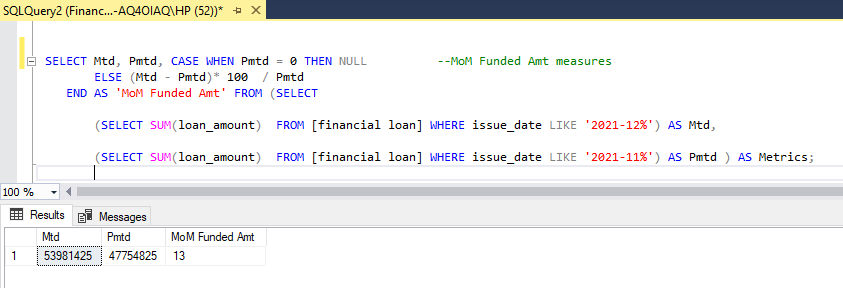
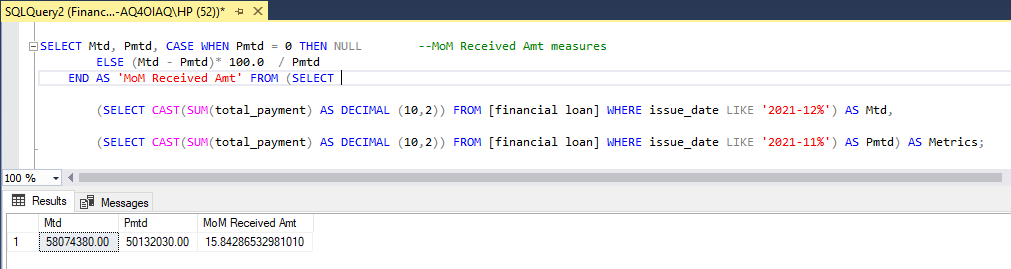
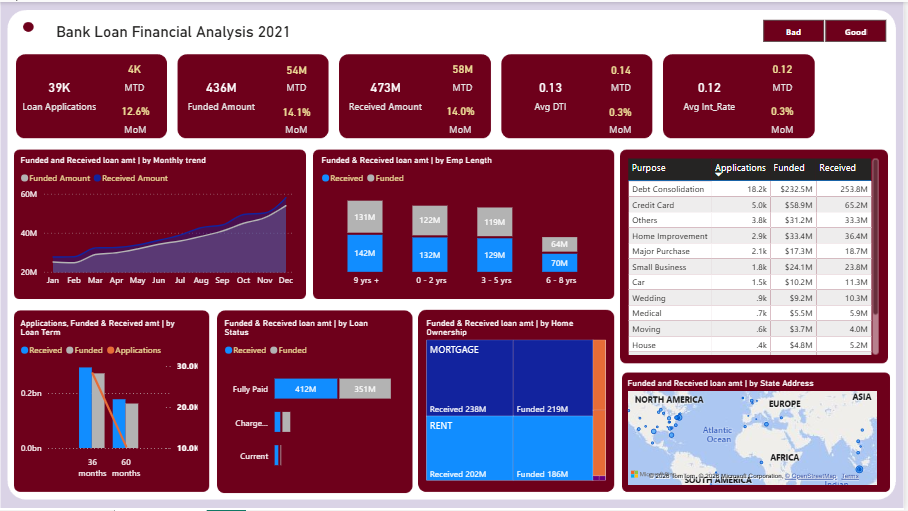
The dashboard provides a detailed breakdown experience, allowing stakeholders to identify not just what happened, but why it happened by comparing Month to Date (MTD) performance against the Month over Month (MoM).
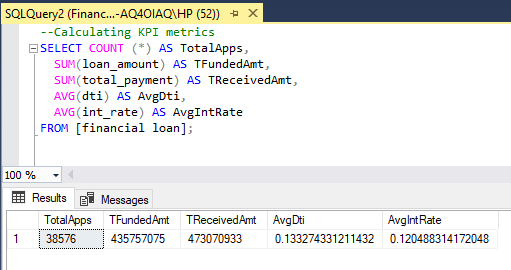
Developed a comprehensive Bank Loan Intelligence System that analyzes over $435M in loan data to monitor portfolio health and borrower risk. By visualizing key metrics like a 13.3% average DTI and identifying Debt Consolidation as the primary loan driver, this project provides actionable insights to improve lending strategies and maintain a 86.2% Good Loan rate.
Questions
-
How is the overall loan portfolio performing? (Answered by the 86.2% Good Loan vs. 13.8% Bad Loan split).
-
What is the total financial exposure and recovery status? (Answered by the $435.8M Funded Amount vs. the $473.1M Total Amount Received).
-
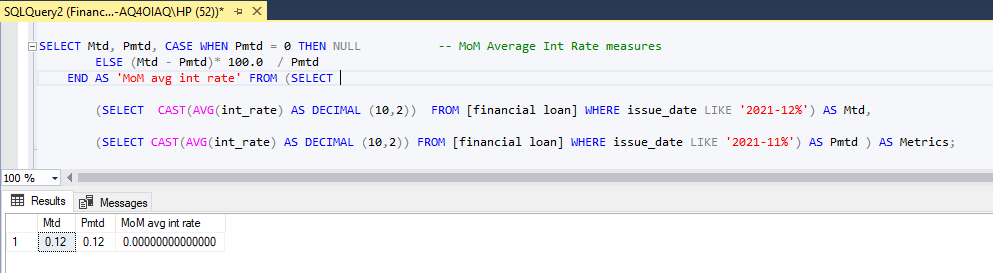
Are we maintaining a healthy profit margin? (Answered by the 12.0% Average Interest Rate compared to the volume of funded loans).
-
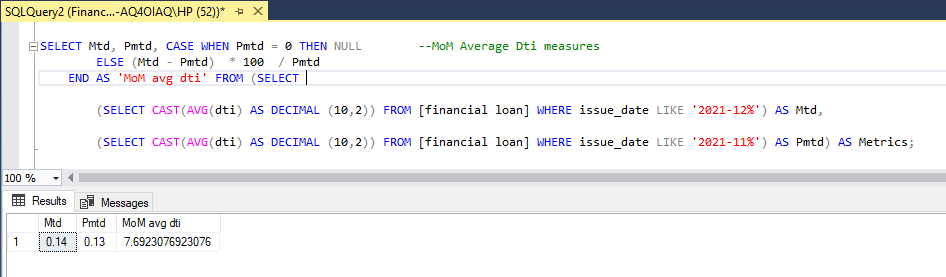
What is the average financial burden on our borrowers? (Answered by the 13.3% Average Debt-to-Income (DTI) ratio).
-
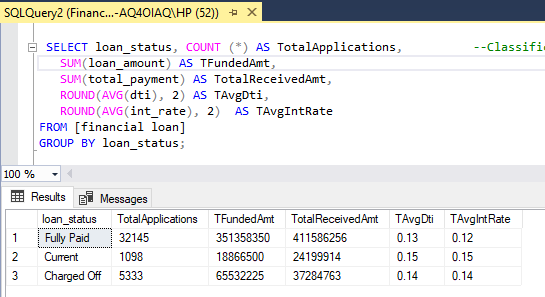
Which loan types are most likely to fail? (Answered by the “Bad Loan” breakdown in the Summary dashboard).
-
Are longer-term loans riskier than shorter ones? (Answered by the Term breakdown—36 months vs. 60 months—on the Overview page).
-
What is our “ideal” customer profile? (Answered by the Employment Length and Home Ownership charts).
-
What are the primary drivers for people seeking credit? (Answered by the “Loan Purpose” chart, e.g., Debt Consolidation).
-
Does job stability correlate with loan volume? (Answered by the breakdown of applications from people with 10+ years of work history).
-
Is the demand for loans growing or shrinking? (Answered by the “Total Loan Applications by Month” line chart).
-
Where is our business geographically concentrated? (Answered by the “Loan Applications by State” map).
-
Are we seeing a month-over-month (MoM) improvement in collections? (Answered by the MoM percentage indicators on the Summary cards).
-
Which specific individuals or accounts require immediate follow-up? (Answered by the Details table, allowing managers to see specific loan statuses and payment dates).
-
How are different grades of loans (A, B, C, etc.) performing across the board? (Answered by the Grade and Sub-Grade filters in the detailed report).
Data Source
Tools
| Tools | Purpose |
|---|---|
| SQL, Power BI | DAX, Power Query |
Stages
-
Import cleaned and process data in SQL.
-
Export processed data from SQL to PowerBI (power query) for Interactive and dynamic visualization.
-
Modeled data to; (1) Improves query performance and report responsiveness. (2) Simplifies DAX logic by enforcing a single-direction filter flow.
(3) Ensures accurate time-intelligence calculations. (4) It follows industry best practices for Power BI solutions.
-
Create a custom ‘slicer’ as a toggle button to view across 2 pillars of business. (Good and Bad Loans), and to return “All” if slicer is cleared.
-
Wrote DAX measures to calculate for Dynamic report.
Chart types and Why?
-
Card Visuals - Shows the KPIs metrics (Applications, Funded and Received amount, Avg DTI and Int Rate, MTD & MoM), and also the dynamic report title.
-
Table Charts - Shows the application, funded and received by loan purpose.
-
Treemap - Shows the application, funded and received loans by home ownership.
-
Map - Used to depict the geo location of loan borrowers / applicants.
-
Column Bar (Combo) - Shows the categorical distribution of loans by employment length.
-
Bar - It display the categorical distribution of loan status between Charged off (Bad), Current and Fully Paid (Good).
-
Line - It is used to show the monthly trends of applications, funded, and received amount.
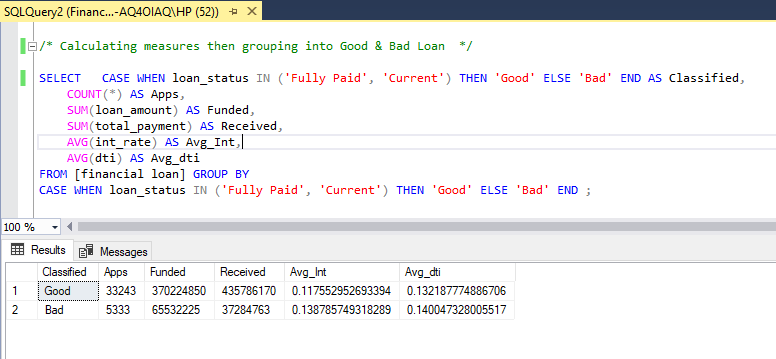
Processing - SQL.
Dashboard
This dashboard allows the Sales Director to pivot from ‘General Observation’ to ‘Targeted Action’ for example, specifically investigating the November slump or renegotiating low-margin accounts identified in the scatter plot.
Data Transformation
Here are the Key DAX formulas used in this project:
-
Applications = VAR FilterState = [Loan Quality_Filter] RETURN CALCULATE( COUNT(financial_loan[Id]), FILTER( financial_loan, FilterState = 0 || (FilterState = 1 && financial_loan[Loan Quality] = “Good”) || (FilterState = 2 && financial_loan[Loan Quality] = “Bad”) ) )
- This measure count all loans applications.
-
Funded = VAR FilterState = [Loan Quality_Filter] RETURN CALCULATE( SUM(financial_loan[Loan_Amount]), FILTER( financial_loan, FilterState = 0 || (FilterState = 1 && financial_loan[Loan Quality] = “Good”) || (FilterState = 2 && financial_loan[Loan Quality] = “Bad”) ) )
- This measure total all funded amount.
-
Received = VAR FilterState = [Loan Quality_Filter] RETURN CALCULATE( SUM(financial_loan[Total_Payment]), FILTER( financial_loan, FilterState = 0 || (FilterState = 1 && financial_loan[Loan Quality] = “Good”) || (FilterState = 2 && financial_loan[Loan Quality] = “Bad”) ) )
- This measure sums the payment from loan borrowers.
-
Avg Int = VAR FilterState = [Loan Quality_Filter] RETURN CALCULATE( AVERAGE(financial_loan[Int_Rate]), FILTER( financial_loan, FilterState = 0 || (FilterState = 1 && financial_loan[Loan Quality] = “Good”) || (FilterState = 2 && financial_loan[Loan Quality] = “Bad”) ) )
- This measure is used to calculate the AVG Int Rate
-
Avg DTI = VAR FilterState = [Loan Quality_Filter] RETURN CALCULATE( AVERAGE(financial_loan[DTI]), FILTER( financial_loan, FilterState = 0 || (FilterState = 1 && financial_loan[Loan Quality] = “Good”) || (FilterState = 2 && financial_loan[Loan Quality] = “Bad”) ) )
- This measure is used to calculate the AVG DTI
Findings
-
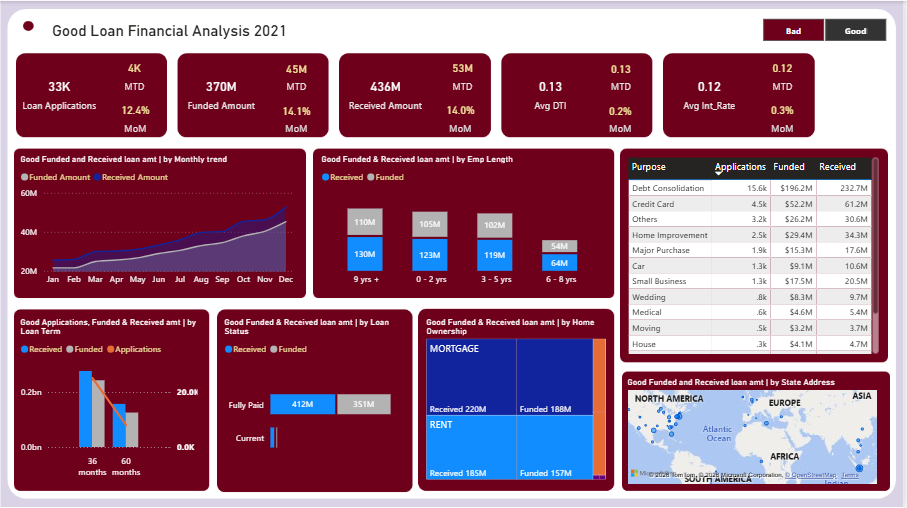
86.2% of all loans are “Good Loans” (Fully Paid or Current), totaling $370.2M in funded value.
-
Most borrowers are highly stable, with 10+ years of employment history and living in rented or mortgaged homes.
-
Debt Consolidation is by far the most common reason people apply for loans, followed by Credit Card payments.
-
There is a clear upward trend in loan applications from the start of the year toward the end (peaking in December).
-
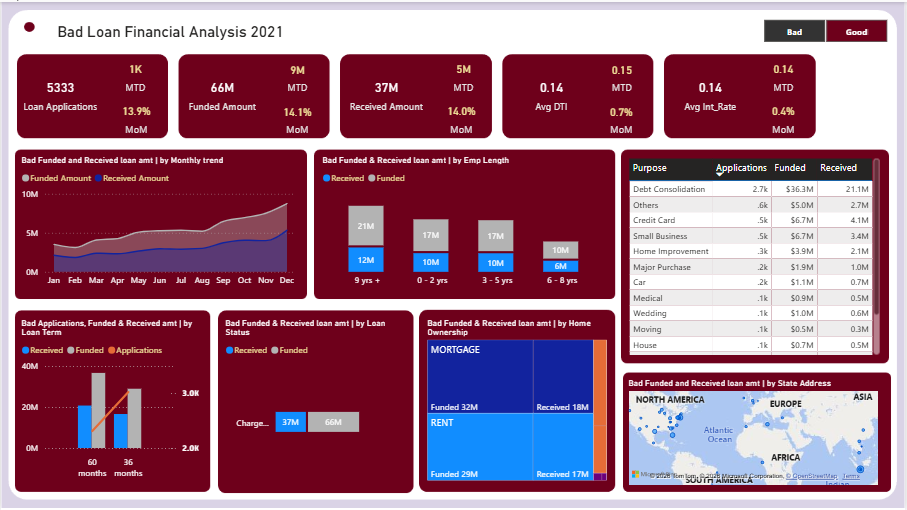
About 13.8% of loans are “Bad Loans” (Charged Off), which represents roughly $65.5M in total funded amount.
Recommendations
-
Create marketing campaigns specifically for employees with 10+ years of experience, as they are your most active and reliable customers.
-
Since this is the #1 loan purpose, offer a streamlined “Express” approval process for debt consolidation to capture more market share.
-
Focus marketing spend on California (CA), Texas (TX), and New York (NY), as these states show the highest demand and volume.
-
Investigate the “60-month” loan terms more closely; longer terms often carry higher risks. Consider stricter credit requirements for 5-year loans.