Business Intelligence Report
Table of Contents
- Project brief
- Objective
- Questions to Answer
- Tools
- Dashboard design charts
- Development
- Data Cleaning
- Data processing
- Insights
- Recommendations
- Action Plan
Project brief
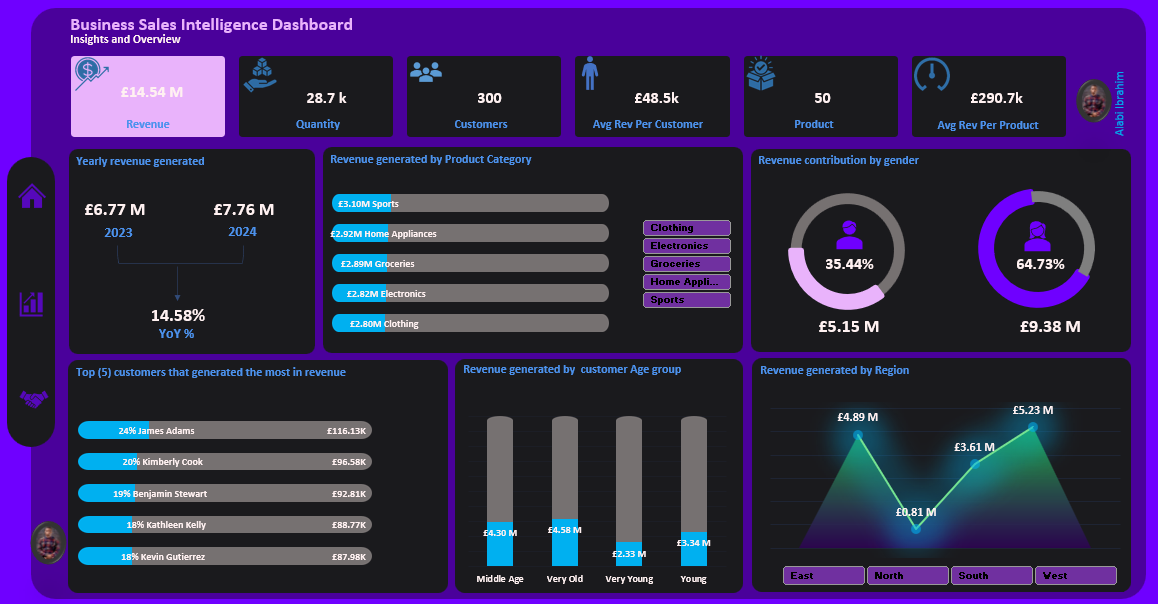
I built this interactive dashboard to pinpoint revenue drivers across 300 customers and 50 product lines. Featuring granular weekly distribution and quarterly YoY comparisons, it provides the executive clarity needed to scale the £48.5k average revenue per customer through data-backed inventory and marketing shifts.
Objectives / Questions to answer
Client Request: Assistance in Building a Sales Dashboard in Excel. I would like the dashboard to include the following key features:
• KPIs at the top: Total Units Sold, Overall Sales Revenue, Average Revenue per Customer, and Average Revenue per Product.
• Comparison visuals: Year-over-year (YoY) revenue for 2023 vs 2024, monthly revenue trends, and revenue by weekdays vs weekends.
• Category insights: Revenue generated by category and top products driving sales.
• Customer insights: Top-5 revenue-generating customers, revenue contribution by gender, and revenue breakdown by age segments.
• Regional insights: Regional sales performance and revenue distribution across segments.
• Interactivity: Ability to filter by product categories (Clothing, Electronics, Groceries, Home Appliances, Sports) and by region (East, North, South, West).
Tools
| Tools | Purpose | Data |
|---|---|---|
| Excel - PowerQuery, DAX | Clean, Analyze & Visualization |
Here are the metrics / columns used in achieving the project goal
- KPIs
- Product segment
- Product category / Name
- Gender
- Age
- Region
- Monthly (Weekly)
- Year (Quarterly)
- Top / Bottom performing product
- Top customers
Dashboard design
Here is a list of appropriate chart visuals used in answering key questions.
- Score cards
- Donut chart
- Progress Bar / Column chart
- Rating chart
- Lollipop chart
- Line chart
- Filter panel
Development
Here’s a step by step guide on how the data was approached
- Get data from source
- Load to Excel
- Clean and transform data with Excel - Power Query and DAX.
- Visualizations using Excel customized charts.
- Share Insights.
- Give recommendations .
Data Cleaning
The goal is to clean the dataset to ensure data integrity, accuracies and standardization.
- Only relevant columns was retained.
- Standardized data types for each column to maintain data accuracy and reduce errors by mismatch formats.
- I handled 5% null values ‘Age’ column by using median imputation.
- Power Query and DAX used to clean, analyze and create complex measures.
Analysis
Monthly analysis
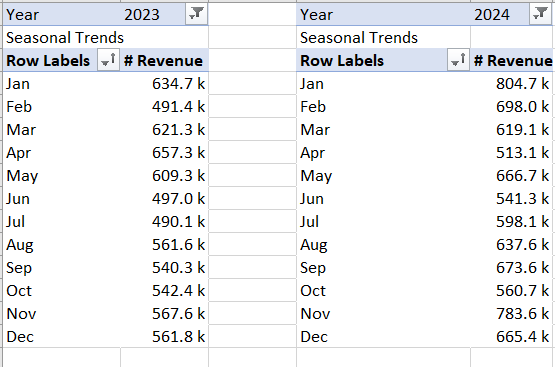
Yearly analysis
Weekly analysis
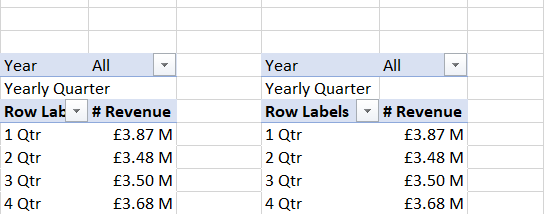
Yearly Quarter analysis
Weektype analysis
Gender analysis
Regional analysis
Top performing product
Underperforming product
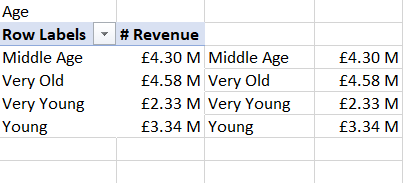
Age group analysis
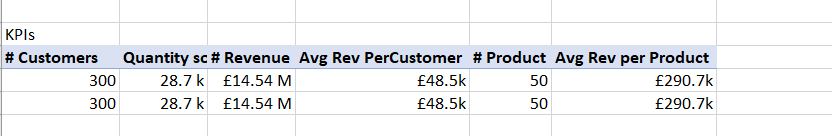
KPIs metric
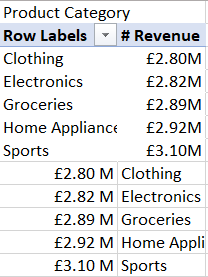
Product category analysis
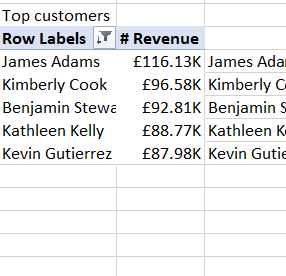
Top customers analysis
Insights
Profitability
-
Revenue generared in total is £14.54m. 28.7k in quantity sold.
-
300 customers and available product of 50. The average cost per customers and product is 48.5k & 290.7k.
-
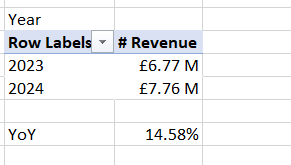
Total revenue for 2023 is £6.77m and 2024 is £7.26m, indicating YoY growth of 14.58%.
-
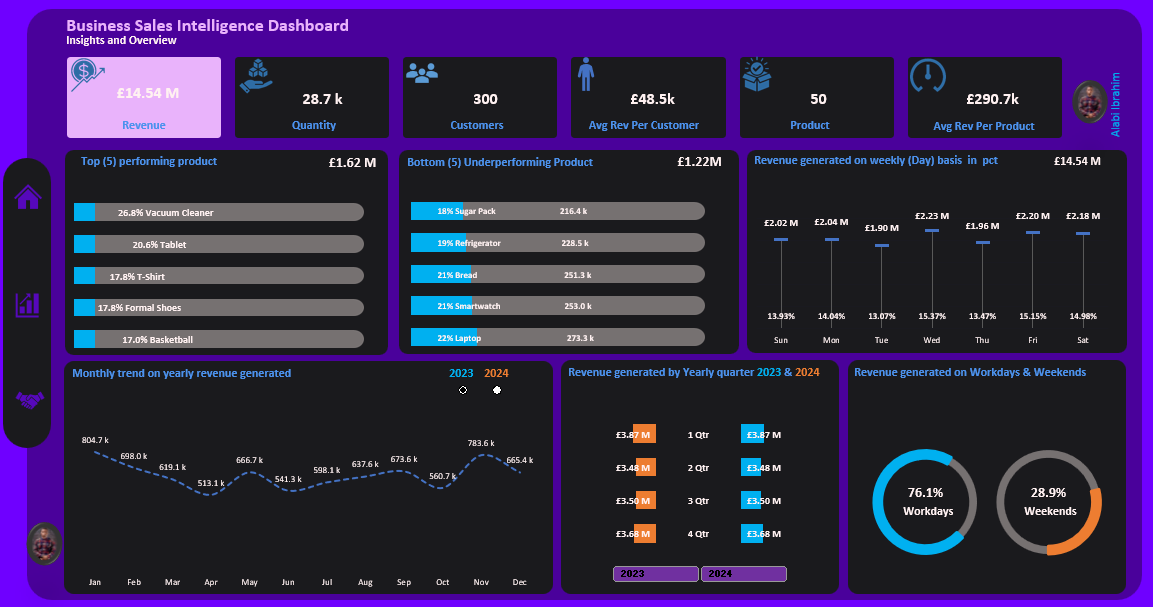
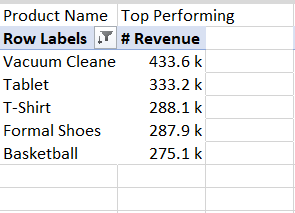
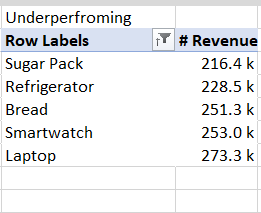
Top selling products with £1.62m in sales, and bottom selling with £1.22m sales, stating there’s little differenece (400k) between them.
-
Sales are well-balanced across categories, with Sports leading slightly. No single category dominates, suggesting healthy diversification but also opportunity for strategic focus.
Customer Behavior
-
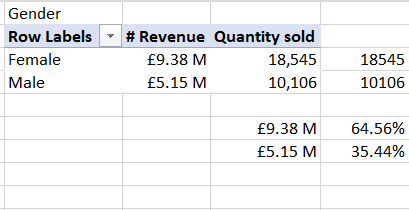
Female customers tend to generate more in revenue than male customers with a huge difference of 64.73%.
-
Customers above 35 yrs of age purchased more products than customers less than age 35.
Regional Risk
-
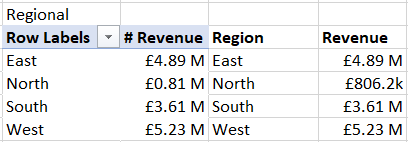
North region sales record is signifcantly low compared to other regions having the least of 800k. This might be due to its low customers % rate.
-
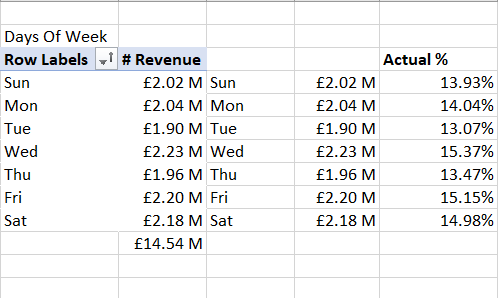
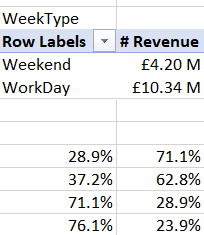
Sales sky rocket on workdays (76.1%) more than weekends (28.9%).
-
The West region generated the highest in revenue with £5.23m followed by the East region having made a sum of £4.89m.
Recommendations
-
Since customers <35 are under-indexing by 20% in the ‘Home Appliances’ category, launch a targeted ‘First Home’ bundle campaign.
-
Use social media and influencer marketing to attract younger customers.
-
Develop or promote more unisex or male-oriented product lines.
-
Run targeted ads for sports products through male-focused channels.
-
Create loyalty programs targeting top customers.
-
Offer personalized recommendations based on purchase history..
-
Increase stock and marketing of high-margin top performers (e.g., Vacuum Cleaners).
-
Evaluate the profitability of low-performing products for potential discontinuation…
-
Conduct localized marketing campaigns or events mostly targeting the North region.
-
Assess pricing or availability issues in underperforming areas.
Action Plan
-
Run gender-targeted ad campaigns, launch weekend promotions.
-
Regional growth initiatives (North), new youth offers.
-
Product mix optimization and loyalty program launch.