Financial Loan Analysis
Table of Contents
- Project brief
- Objective
- Questions to Answer
- Data source
- Tools
- Dashboard design charts
- Development
- Data processing / Transformation
- Findings
- Recommendations
Project brief
Financial Loan Analysis
Objective
This report aims to provide insights into key loan-related metrics and their changes over time. The report will help us make data-driven decisions, track our loan portfolio’s health, and identify trends that can inform our lending strategies.
Questions to answer
-
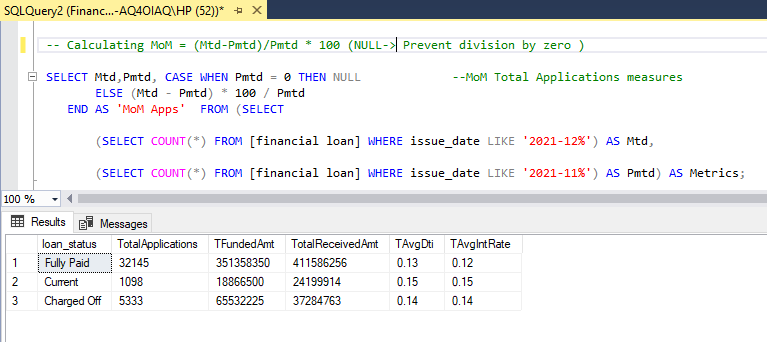
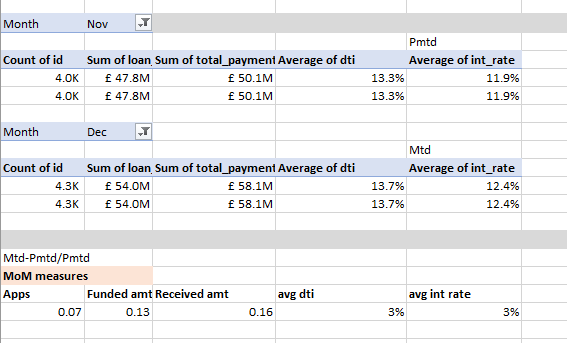
Total Loan Applications: We need to calculate the total number of loan applications received during a specified period. Additionally, it is essential to monitor the Month-to-Date (MTD) Loan Applications and track changes Month-over-Month (MoM).
-
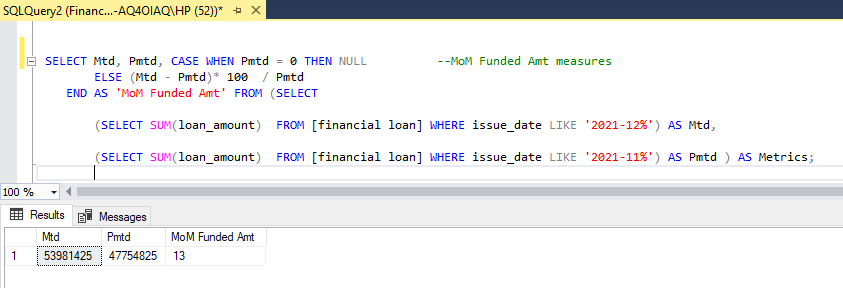
Total Funded Amount: Understanding the total amount of funds disbursed as loans is crucial. We also want to keep an eye on the MTD Total Funded Amount and analyse the Month-over-Month (MoM) changes in this metric.
-
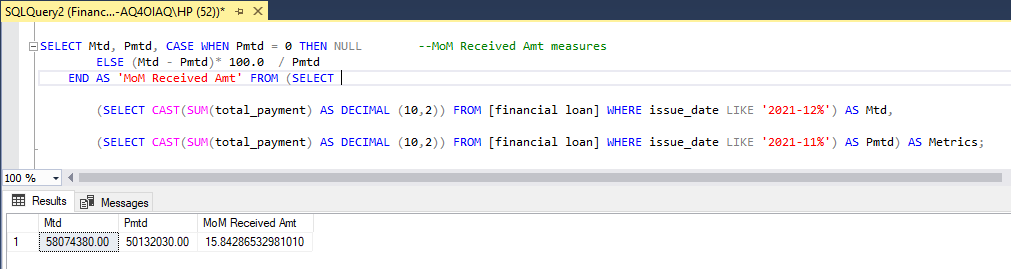
Total Amount Received: Tracking the total amount received from borrowers is essential for assessing the bank’s cash flow and loan repayment. We should analyse the Month-to-Date (MTD) Total Amount Received and observe the Month-over-Month (MoM) changes.
-
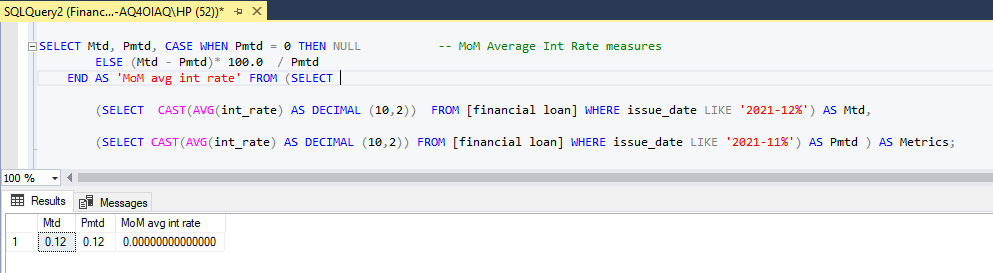
Average Interest Rate: Calculating the average interest rate across all loans, MTD, and monitoring the Month-over-Month (MoM) variations in interest rates will provide insights into our lending portfolio’s overall cost.
-
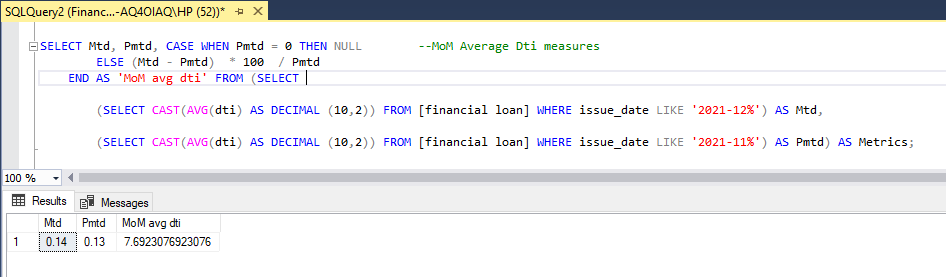
Average Debt-to-Income Ratio (DTI): Evaluating the average DTI for our borrowers helps us gauge their financial health. We need to compute the average DTI for all loans, MTD, and track Month-over-Month (MoM) fluctuations.
-
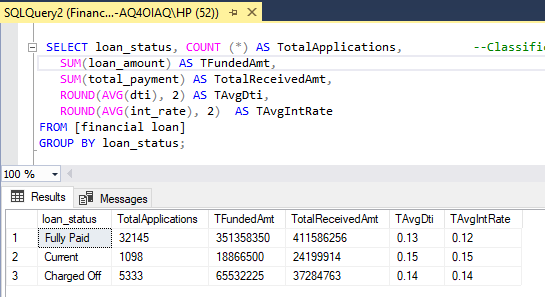
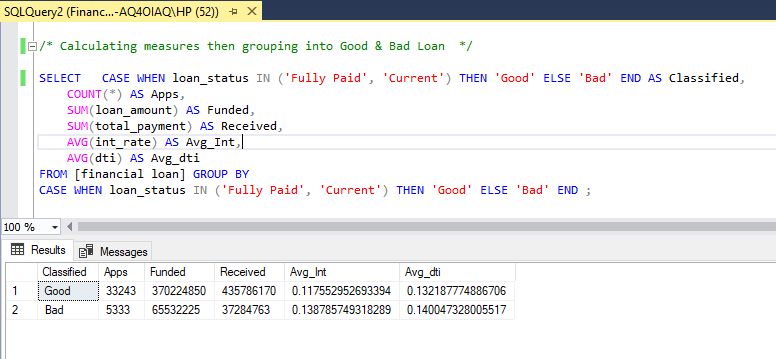
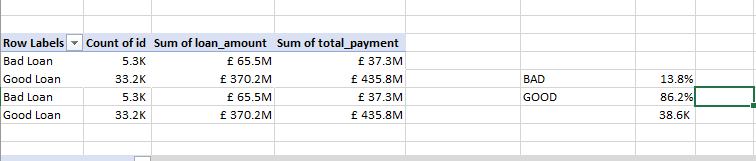
Good & Bad Loan Application Percentage: We need to calculate the percentage of loan applications classified as ‘Good Loans.’ This category includes loans with a loan status of ‘Fully Paid’ and ‘Current.’
-
Good & Bad Loan Applications: Identifying the total number of loan applications falling under the ‘Good Loan’ category, which consists of loans with a loan status of ‘Fully Paid’ and ‘Current.’
-
Good & Bad Loan Funded Amount: Determining the total amount of funds disbursed as ‘Good Loans.’ This includes the principal amounts of loans with a loan status of ‘Fully Paid’ and ‘Current.’
-
Good & Bad Loan Total Received Amount: Tracking the total amount received from borrowers for ‘Good Loans,’ which encompasses all payments made on loans with a loan status of ‘Fully Paid’ and ‘Current.’
Dataset
Data source
Here are the Data needed to achieve project goal
- Total loan applications (Month-to-date, Month-over-Month)
- Funded Amount (Month-to-date, Month-over-Month)
- Received amount (Month-to-date, Month-over-Month)
- Average Interest rate (Month-to-date, Month-over-Month)
- Average Debt to Income (Month-to-date, Month-over-Month)
- Home ownership
- Loan status
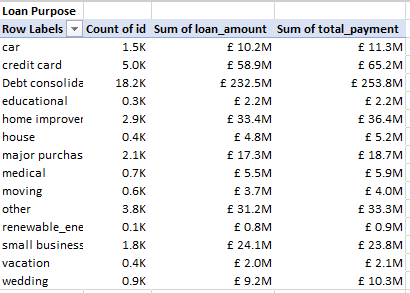
- Loan purpose
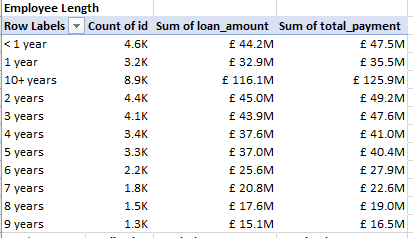
- Employment status
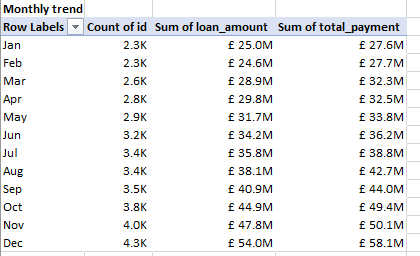
- Monthly trends
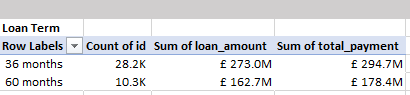
- Loan term
Tools
| Tools | Purpose |
|---|---|
| SQL | Cleaning, Standardization. |
| Excel | Processing, Visualizations. |
Dashboard design
Here is a list of appropriate chart visuals used answering key questions.
- Score cards
- Column chart
- Donut chart
- Line chart
- Scatter chart
- Tree map
- Bar chart
- Slicers

Development
Here’s a step by step guide on how the data was approached
- Getting the data
- Load and clean data with SQL queries
- Transfer data from SQL database into Excel
- Processing and Visualizations using Excel
- Generate Insights
- Give recommendations
Data Cleaning / Processing
The goal is to refine the dataset to ensure its clean and ready for analysis.
- Only relevant columns should be retained.
- All data types should be appropriate for the contents of each column.
- No column should contain null values, indicating complete data for all records
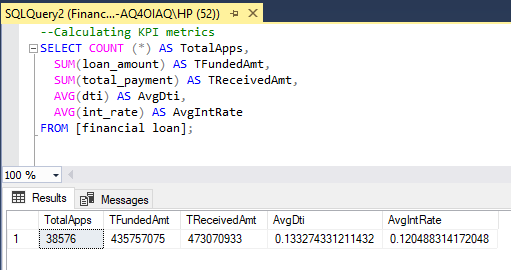
SQL Cleaning
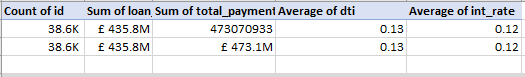
Excel Processing

Findings
-
With 38.6K total applications but only £435.8M funded versus £473.1M received, indicating potential liquidity or risk management challenges.
-
DTI at 13% appears manageable, but the significant gap between funded and received amounts suggests funding capacity limitation.
-
Interest rate seems unusually low with 12%, which may be impacting profitability margins.
-
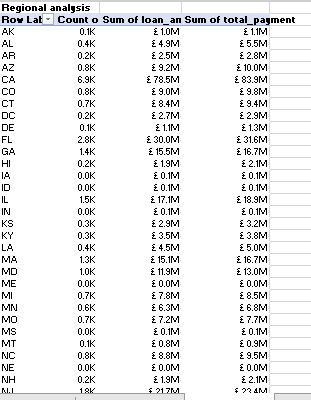
The loan distribution by region shows heavy concentration in specific areas, creating potential risk if those regions experience economic downturns.
-
Varying loan performance across different employment tenure groups, with some segments showing higher risk profiles that need targeted strategies.
-
The breakdown reveals significant concentration in certain loan categories (debt consolidation, major purchases), suggesting need for product diversification.
Recommendations
-
Review funding capacity constraints that are limiting loan disbursements.
-
Analyze the pricing strategy given the low average interest rate.
-
Implement geographic diversification strategies to reduce concentration risk.
-
Develop targeted underwriting criteria for different employment length segments.
-
Create product offerings for underrepresented loan purposes.
-
Establish monthly trending analysis to identify seasonal patterns and optimize timing.
Action plan
-
Target the mortgage and other loan categories that appear underrepresented.
-
Develop specialized products for different employment tenure groups.
-
Leverage the strong performance in certain regions for expansion.