Marketing Campaign Performance
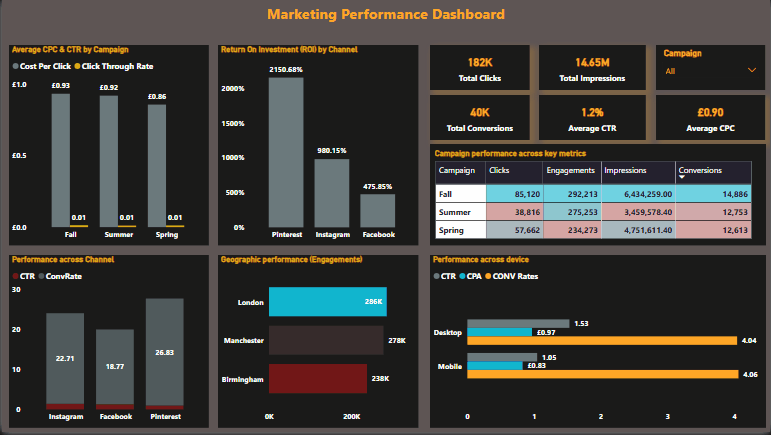
Table of contents
- Project brief
- Objective
- Key Questions to Answer
- Data source
- Tools
- Dashboard design charts
- Stages
- Dataprocessing&Transformation
- Findings
- Recommendations
Project Brief:
Marketing Campaign Performance Analysis
Objectives
This project aims to analyze marketing data to gain insights into the effectiveness of campaign performance, optimize the ad spend, and improve future marketing strategies.
• Evaluate Campaign Performance: Assess the overall performance of each campaign in terms of reach, engagement, and conversions.
• Channel Effectiveness: Determine which advertising channels are driving the best results.
• Geographical Insights: Identify the cities that show the highest engagement and conversion rates.
• Device Performance: Understand how ads perform across different devices.
• Ad-Level Analysis: Analyze the performance of individual ads to identify high-performing creatives.
• ROI Calculation: Calculate the return on investment (ROI) for each campaign.
• Time Series Analysis: Track the performance trends over time to identify patterns and seasonal effects.
Key Questions to Answer
-
Campaign Performance: Which campaign generated the highest number of impressions, clicks, and conversions? What is the average cost-per-click (CPC) and click-through rate (CTR) for each campaign?
-
Channel Effectiveness: Which channel has the highest ROI? How do impressions, clicks, and conversions vary across different channels?
-
Geographical Insights: Which cities have the highest engagement rates (likes, shares, comments)? What is the conversion rate by city?
-
Device Performance: How do ad performances compare across different devices (mobile, desktop, tablet)? Which device type generates the highest conversion rates?
-
Ad-Level Analysis: Which specific ads are performing best in terms of engagement and conversions? What are the common characteristics of high-performing ads?
-
ROI Calculation: What is the ROI for each campaign, and how does it compare across different channels and devices? How does spend correlate with conversion value across different campaigns?
-
Time Series Analysis: Are there any noticeable trends or seasonal effects in ad performance over time?
Data Source
Tools
| Tools | Purpose |
|---|---|
| SQL | Cleaning, Transformation, Processing |
| POWER BI | DAX Measures, Visualizations |
Dashboard Design
Here’s how I played around with the datasets using right chart visuals to tell a compelling story.
- Score cards
- Column chart
- Donut chart
- Line chart
- Clustered bar/column chart
- Bar chart
- Tree map
Stages
Here’s a step-by-step guide on how the data was approached
- Get the data from source
- Load data into SQL
- Clean and process with SQL
- Export to Power BI for visualizations
- Generate Insights
- Give recommendations
Data Processing & Transformation
This section contains the cleaning process and transformation and metrics used in arriving at the right analysis/ results.
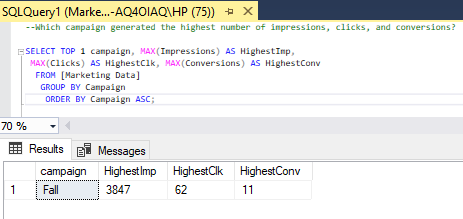
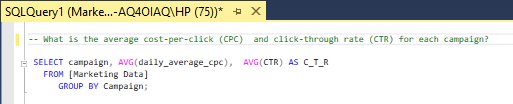
-- (1) Which campaign generated the highest number of impressions, clicks, and conversions? (2) What is the average cost-per-click (CPC) and click-through rate (CTR) for each campaign?

SELECT TOP 1 campaign, 			-- Highest number of imp, clk, and conv
  MAX(Impressions) AS HighestImp, MAX(Clicks) AS HighestClk,
  MAX(Conversions) AS HighestConv
FROM [Marketing Data]
GROUP BY Campaign
ORDER BY Campaign ASC;
SELECT campaign, 				-- Average CPC and CTR for each campaign
  AVG(daily_average_cpc) AS CPC,  AVG(CTR) AS C_T_R
FROM [Marketing Data]
GROUP BY Campaign;
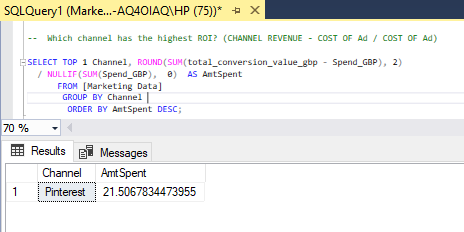
--  (1) Which channel has the highest ROI? (2) How do impressions, clicks, and conversions vary across different channels?

SELECT TOP 1 Channel, 					-- Highest ROI
  ROUND (SUM(total_conversion_value_gbp - Spend_GBP), 2) /
  NULLIF(SUM(Spend_GBP),  0)  AS AmtSpent
FROM [Marketing Data]
GROUP BY Channel
ORDER BY AmtSpent DESC;
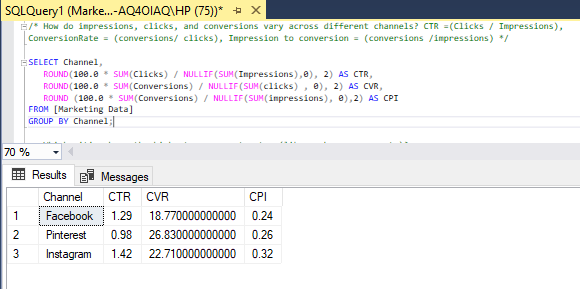
SELECT Channel, 					-- Imp, clk, and conv across channels
   ROUND (100.0 * SUM(Clicks) / NULLIF(SUM(Impressions),0), 2) AS CTR,
   ROUND (100.0 * SUM(Conversions) / NULLIF (SUM (clicks), 0), 2) AS CVR,
   ROUND (100.0 * SUM(Conversions) / NULLIF (SUM (impressions), 0),2) AS CPI
FROM [Marketing Data]
GROUP BY Channel;
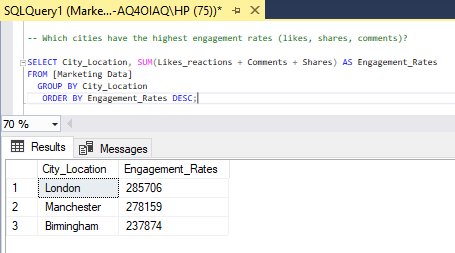
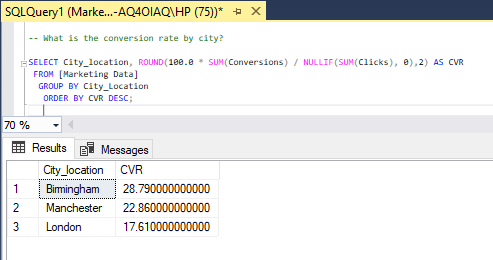
--  (1) Which cities have the highest engagement rates (likes, shares, comments)? (2) What is the conversion rate by city?

SELECT City_Location, 				-- cities highest engagement rates
  SUM(Likes_reactions + Comments + Shares) AS Engagement_Rates
FROM [Marketing Data]
GROUP BY City_Location
ORDER BY Engagement_Rates DESC;
SELECT City_location, 					-- conversion rate by city
  ROUND(100.0 * SUM(Conversions) / NULLIF(SUM(Clicks), 0),2) AS CVR
FROM [Marketing Data]
GROUP BY City_Location
ORDER BY CVR DESC;
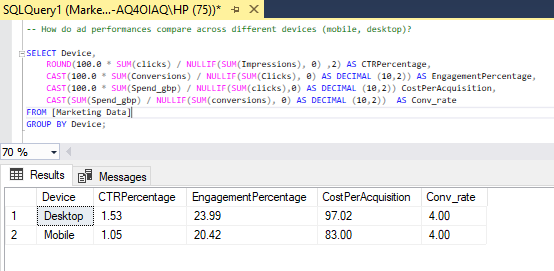
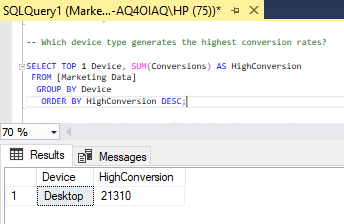
-- (1) How do ad performances compare across different devices (mobile, desktop, tablet)? (2) Which device type generates the highest conversion rates?

SELECT Device, 		-- Ad performance across devices (mobile, desktop)
  ROUND(100.0 * SUM(clicks) / NULLIF(SUM(Impressions), 0) ,2) AS CTRPercentage,
  CAST(100.0 * SUM(Conversions) / NULLIF(SUM(Clicks), 0) AS DECIMAL (10,2)) AS Engment%,
  CAST(100.0 * SUM(Spend_gbp) / NULLIF(SUM(clicks),0) AS DECIMAL (10,2)) AS CPA
  CAST(SUM(Spend_gbp) / NULLIF(SUM(conversions), 0) AS DECIMAL (10,2))  AS Conv_rate
FROM [Marketing Data]
GROUP BY Device;
SELECT TOP 1 Device, 			-- Highest conv by device type
  SUM(Conversions) AS HighConversion
FROM [Marketing Data]
GROUP BY Device
ORDER BY HighConversion DESC;
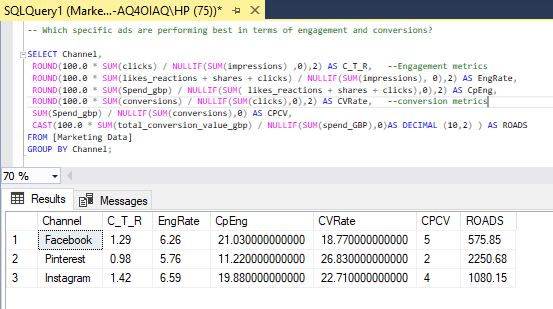
-- (1) Which specific ads are performing best in terms of engagement and conversions? (2) What are the common characteristics of high-performing ads?

SELECT Channel, 			-- Ads performance by engagement and conversions
 ROUND(100.0 * SUM(clicks) / NULLIF(SUM(impressions) ,0),2) AS C_T_R,
 ROUND(100.0 * SUM(likes_reactions + shares + clicks) / NULLIF(SUM(impressions), 0),2) AS EngRate,
 ROUND(100.0 * SUM(Spend_gbp) / NULLIF(SUM( likes_reactions + shares + clicks),0),2) AS CpEng,
 ROUND(100.0 * SUM(conversions) / NULLIF(SUM(clicks),0),2) AS CVRate,
 SUM(Spend_gbp) / NULLIF(SUM(conversions),0) AS CPCV,
 CAST(100.0 * SUM(total_conversion_value_gbp) / NULLIF(SUM(spend_GBP),0)AS DECIMAL (10,2) ) AS ROADS
FROM [Marketing Data]
GROUP BY Channel;
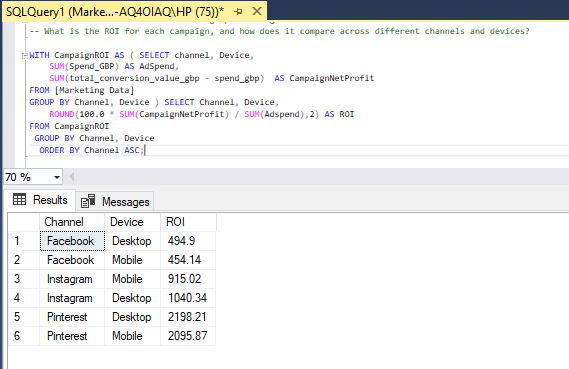
-- (1) What is the ROI for each campaign, and how does it compare across different channels and devices?
-- (2) How does spend correlate with conversion value across different campaigns?

WITH CampaignROI AS ( SELECT channel, Device,
	SUM(Spend_GBP) AS AdSpend,
	SUM(total_conversion_value_gbp - spend_gbp)  AS CampaignNetProfit
FROM [Marketing Data]
GROUP BY Channel, Device ) SELECT Channel, Device,
	ROUND(100.0 * SUM(CampaignNetProfit) / SUM(Adspend),2) AS ROI
FROM CampaignROI
GROUP BY Channel, Device
ORDER BY Channel ASC;	-- Campaign ROI, compare across different channels and devices
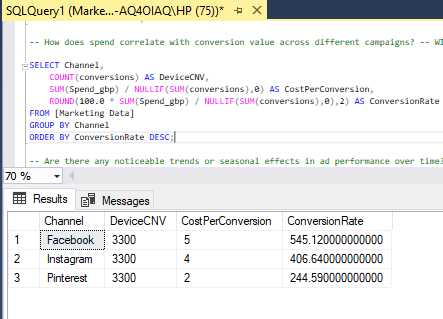
SELECT Channel,
	COUNT(conversions) AS DeviceCNV,
	SUM(Spend_gbp) / NULLIF(SUM(conversions),0) AS CostPerConversion,
	ROUND(100.0 * SUM(Spend_gbp) / NULLIF(SUM(conversions),0),2) AS ConversionRate
FROM [Marketing Data]
GROUP BY Channel
ORDER BY ConversionRate DESC; -- spend correlation with conv value across diff campaigns
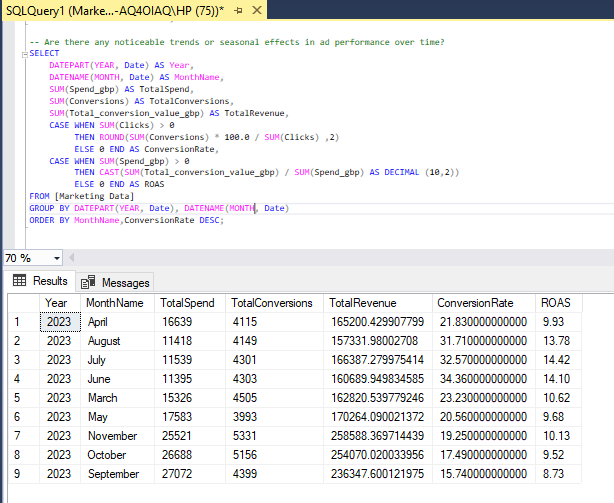
-- Are there any noticeable trends or seasonal effects in ad performance over time?

SELECT 							-- seasonal ad performance

    DATEPART(YEAR, Date) AS Year,
    DATENAME(MONTH, Date) AS MonthName,
    SUM(Spend_gbp) AS TotalSpend,
    SUM(Conversions) AS TotalConversions,
    SUM(Total_conversion_value_gbp) AS TotalRevenue,
    CASE WHEN SUM(Clicks) > 0
         THEN ROUND(SUM(Conversions) * 100.0 / SUM(Clicks) ,2)
         ELSE 0 END AS ConversionRate,
    CASE WHEN SUM(Spend_gbp) > 0
         THEN CAST(SUM(Total_conversion_value_gbp) / SUM(Spend_gbp) AS DECIMAL (10,2))
         ELSE 0 END AS ROAS
FROM [Marketing Data]
GROUP BY DATEPART(YEAR, Date), DATENAME(MONTH, Date)
ORDER BY MonthName,ConversionRate DESC;
Insights
• The fall campaign performs best across all key metrics. It significantly outperforms spring and summer campaigns with Impressions: 6,434,259, Clicks: 85,120, Conversions: 14,886.
• Fall has the highest CTR (1.35%) but also the highest CPC (£0.93). Spring offers the most cost-efficient clicks at £0.86 CPC. Summer has the lowest CTR (1.13%) with CPC nearly as high as Fall (£0.92)
• Pinterest dominates with an exceptional 2150.68% ROI, significantly outperforming Instagram (980.15%) and Facebook (475.85%). This suggests Pinterest delivers far more conversion value relative to spend.
• Facebook delivers the most impressions but has the lowest conversion rate (CVR) of 18.77%. Instagram achieves the highest CTR (1.42%) and second-highest CVR (22.71%). Pinterest has the lowest CTR but highest CVR (26.83%), making the ROI standout.
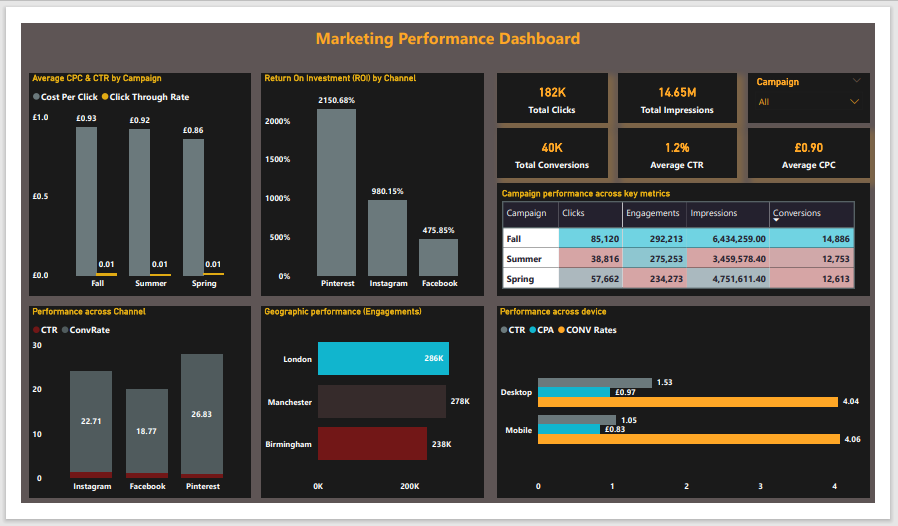
• London shows the highest overall engagement with 285,706 total interactions, followed by Manchester (278,159) and Birmingham (237,874).
• Birmingham has the highest conversion rate at 28.79%, and outperforms Manchester (22.86%) and London (17.61%). This suggests Birmingham audiences are more likely to convert after clicking.
• Desktop generates more conversions (21,310 vs 18,942) and has higher CTR (1.53% vs 1.05%). Mobile is slightly more efficient with lower CPA (£20.42 vs £23.99) and CPC (£0.83 vs £0.97). Conversion rates are nearly identical (4%) across devices.
• Desktop with higher conversion value (£949,684) but also higher spend (£86,187)
• Mobile has lower absolute conversion value (£782,016) but more efficient spend (£76,994)
• Pinterest continues to show exceptional ROI performance. Instagram delivers strong middle-ground performance. Facebook has the lowest ROI among the three channels.
• There’s a strong positive correlation between spend and conversion value, but with diminishing returns at higher spend levels. Pinterest shows the most efficient spend-to-conversion ratio.
• Fall consistently outperforms other seasons across all metrics. Spring shows steady performance with efficient CPC. Summer has the weakest performance with lower CTR and higher CPC.
Recommendations
• Invest more in Pinterest for its exceptional ROI performance.
• Grant more budget to Fall campaigns when consumer responsiveness peaks.
• Optimize Birmingham-targeted ads to leverage the higher conversion rates.
• Maintain balanced device spending as both desktop and mobile performs well.
• Study high-performing ad characteristics and do the same for other campaigns.
• Monitor seasonal trends to expect performance fluctuations.
• Test London engagement strategies in other cities to boost interaction rates.