Excel: Sales Performance Analysis
Table of contents
- Objective
- Questions to answer
- Data Source
- Tools
- Stages
- Design
- Visualization
- Insights
- Recommendations
Objective
To analyze and visualize key sales performance metrics, identify top-selling products, highlight monthly sales trends, and uncover opportunities for growth. This analysis helps stakeholders make data-driven decisions by providing clear insights into sales, profit, customer segments, and shipping methods.
Questions to Answer
-
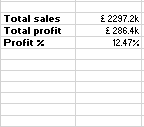
What is our total sales and profit over the selected period?
-
Which months have the highest and lowest sales performance?
-
What are our most and least profitable product sub-categories?
-
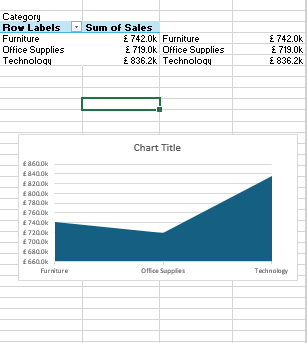
How do product categories (Technology, Furniture, Office Supplies) compare in sales?
-
What trends can we see in monthly sales and order quantities?
-
Which customer segment contributes the most to our revenue?
-
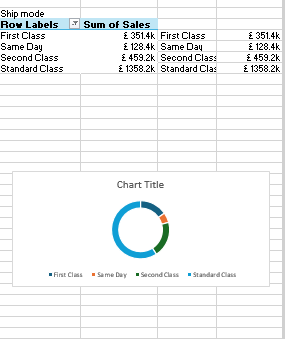
What shipment mode is most commonly used, and how does it relate to sales performance?
-
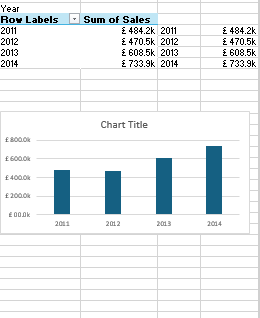
How have sales changed year over year — is there consistent growth?
-
Are there seasonal patterns or specific months we should focus on for marketing and inventory planning?
-
Where should we focus our efforts to improve profit margins and overall performance?
Data Source
Tools
Excel Spreadsheet
Stages
Data cleaning & Processing
-
Functions and Formulas
-
Pivot tables
-
Removing duplicates
-
Average imputation into blank cells
Dashboard Design
- Line chart
- Lollipop chart
- Tree map
- Donut chart
- KPI cards
- Area chart
- Column
- Bar charts
Visualization
Insights
-
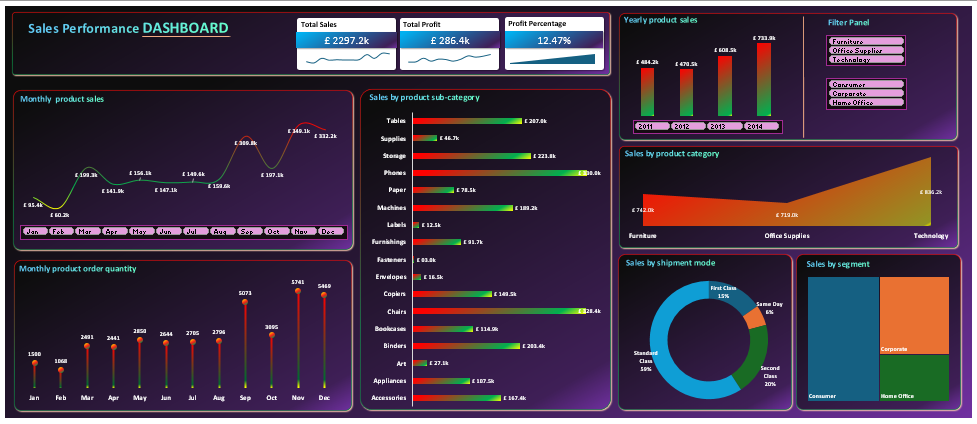
Total Sales of £2,297.2k, Total Profit of £286.4k and Profit Margin of 12.47%.
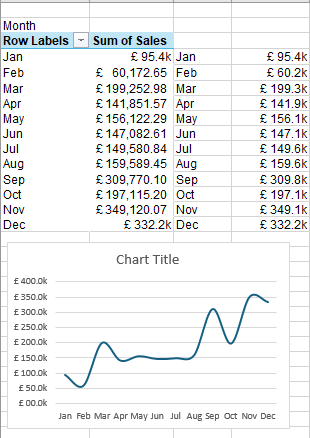
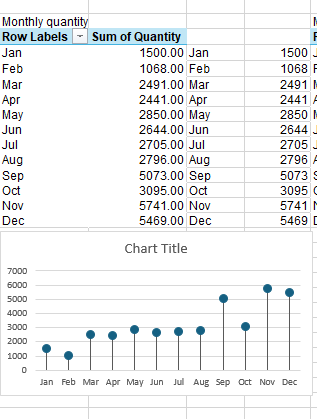
- Sales steadily climb from about £150k in January to £220k in December. Order quantities rise in a similar pattern: from 500 units sold in January to 900 units in December. The fastest growth occurs in the last 6 month of the year (July-December).
-
Technology is the top-seller at roughly £1.1m per year. Office Supplies come in second at about £600k, and Furniture at £500k.
-
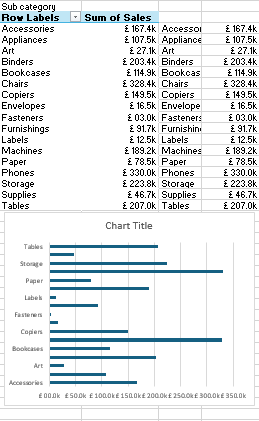
Phones £800k and Chairs £700k are standout subcategories.
-
Binders £100k and Copiers £90k are underperforming.
-
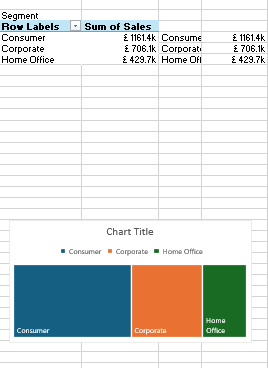
Consumer segment accounts for 40% of sales, Corporate 35%, and Home Office 25%. Standard Class shipping makes up 50% of orders.
- Overall margin sits at 12.5%, but it likely varies by category.
Recommendations
-
Double-down on the best-sellers.
-
Improve underperforming lines.
-
Seasonal Push for marketing campaigns.
-
Optimize Shipping Mix.
-
Segment-Specific Offers.