Superstore Sales Report
Table of Contents
- Project brief
- Objective
- Questions to Answer
- Data source
- Tools
- Dashboard design charts
- Development
- Data Cleaning
- Data processing
- Findings
- Recommendations
Project brief
Analyzed Superstore Sales Report with over £2.3M in sales data using an interactive dashboard.
Objective
To identify top-performing product lines, customer segments, and shipping methods in order to maximize profit growth and streamline sales strategy.
Questions to answer
-
What factors contributed to the YoY profit growth?
-
How does this quarter’s sales compare to the same period last year?
-
Which products or categories are dragging overall profitability down?
-
Why is Technology performing better than Office Supplies and Furniture?
-
What marketing efforts were done specifically for the Technology category?
-
Can we increase profit margins in Office Supplies or Furniture?
-
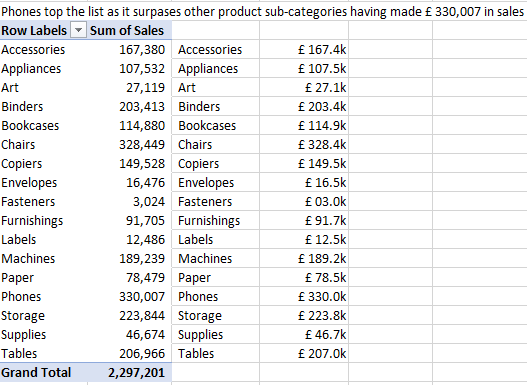
What made Phones the best-performing sub-category?
-
Are low-performing sub-categories worth keeping, or should they be removed or improved?
-
How do profit margins compare across the different sub-categories?
-
What strategies helped the Consumer segment outperform others?
-
How can we improve engagement with Corporate and Home Office segments?
-
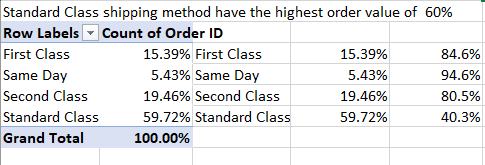
Why do most customers choose Standard Class shipping over faster options?
-
Is there a cost-benefit to promoting Same Day or First Class shipping?
-
Do certain shipping methods result in higher customer satisfaction or repeat purchases?
-
Based on current trends, what will next quarter’s top-selling sub-category likely be?
Tools
| Tools | Purpose |
|---|---|
| Excel | Cleaning, Transformation, Processing and Visualization |
Data
Here are the Data columns used in achieving project goal
- KPIs
- Product segment
- Product category
- Product sub-category
- Shipping method
- Region
- City
- Delivery duration
- Monthly
- Year
Dashboard design
Here is a list of appropriate chart visuals used in answering key questions.
- Score cards
- Column chart
- Donut chart
- Area chart
- Progress Bar chart
- Column chart
- Line chart
- Filter panel
Development
Here’s a step by step guide on how the data was approached
- Get data from source
- Load to Excel
- Clean and transform with Excel
- Visualizations using Excel customized charts
- Generate Insights
- Give recommendations
Data Cleaning
The goal is to clean the dataset to ensure data integrity, accuracies and standardization.
- Only relevant columns will be retained.
- All data types should be appropriate for the contents of each column.
- No column contains null values, indicating complete data for all records.
Processing
Findings
-
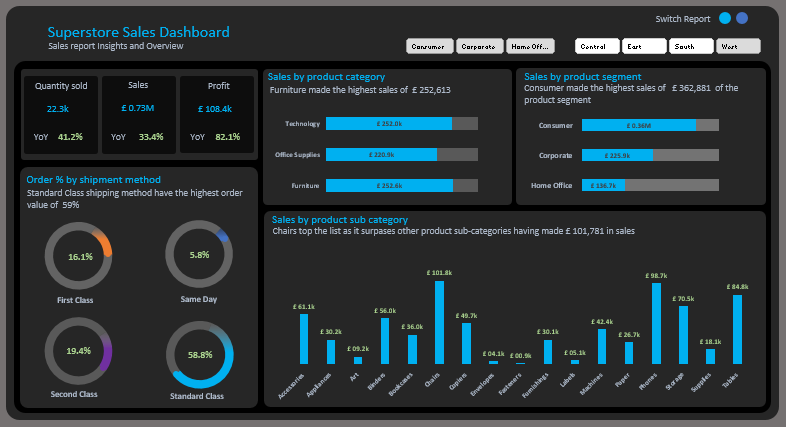
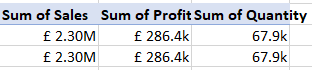
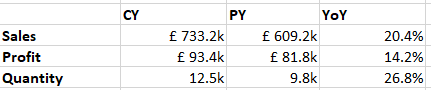
Total Quantity Sold 67.9k units.
-
Total Sales of £2.30M
-
Total Profit of £286.4k
-
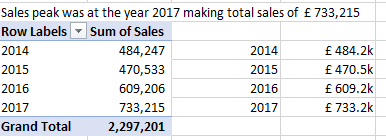
Year-over-Year (YoY) profit increased by 14.2% – a positive trend.
-
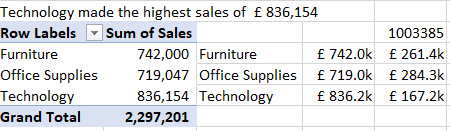
Technology had the highest sales of £836.1k
-
Office Supplies and Furniture followed with £710k and £742k respectively.
-
Phones led with £330k in sales.
-
Followed by Chairs £328.4k, Copiers £203.4k, and Accessories (£167.4k).
-
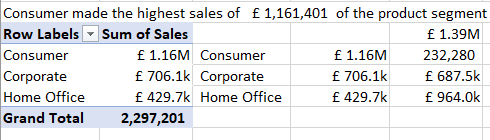
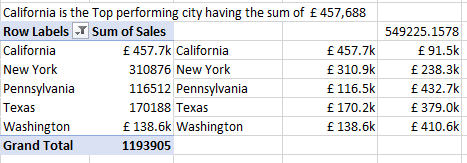
Consumers brought in the highest sales £1.16M, more than Corporate and Home Office.
-
Standard Class accounts for 60% of orders.
-
Same Day and First Class make up smaller shares 15.4% and 19.5%
Recommendations
-
Focus more on Technology and Phone products – promote them in marketing and sales strategies.
-
Increase inventory for high-selling sub-categories like Phones and Chairs.
-
Since Consumers drive most sales, create exclusive offers or loyalty programs for them.
-
Since most orders are Standard Class, explore faster, low-cost shipping options to attract more Same Day or First Class users.
-
Investigate why categories like Home Office are low in sales – is it pricing, demand, or product mix?
-
Suggest accessories or furniture items when customers buy technology items like phones.